INTEGRAL Galactic Plane Scanning
Revolution 2048: Observation start 2019-01-21T13:30 = MJD 58504.563
Total Observation GTI = 157247 seconds
ISGRI
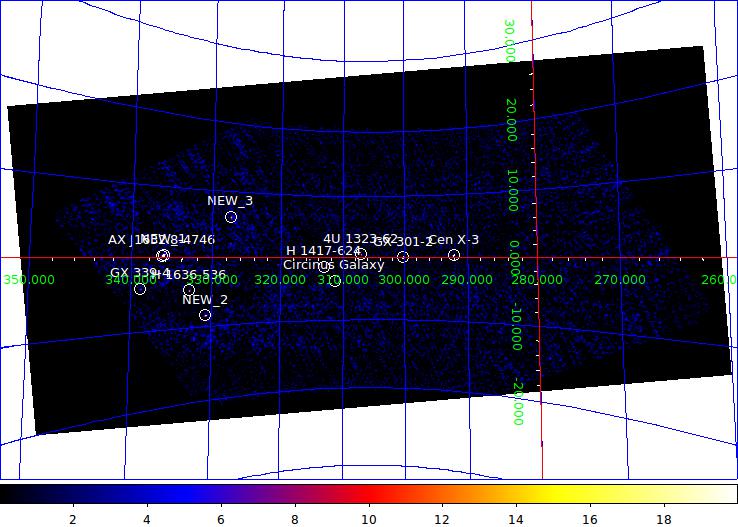
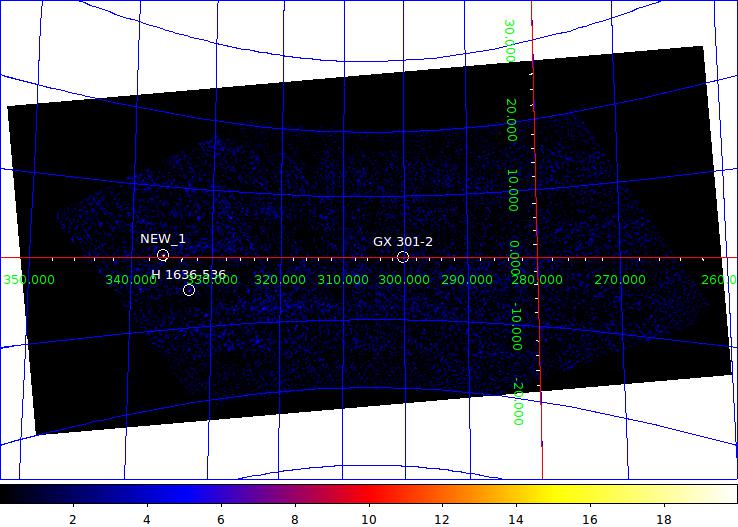
ISGRI significance mosaic images. Top: ISGRI 18-40 keV. Bottom: 40-100 keV
Sources detected > 10σ in each band are marked on the image. The table below lists the fitted position, and statistical positional uncertainty in arcmin returned by the mosaic step of
OSA10.2, of all the sources detected in the 18 - 40 keV range (band A: 1 Crab ~ 208 cps ) and 40 - 100 keV range (band B: 1 Crab ~ 100 cps ) where available.ISGRI Detected Sources 18-40 keV (A) and 40-100 keV (B)
Source Name             RA       dec   +/-    l        b     A(cps)  +/-   sig  B(cps)  +/-   sig
==================== ========  ======= === ======== ======== ====== ===== ===== ====== ===== =====
GX 301-2              186.658  -62.770 0.2  300.099   -0.035   40.7  0.12 334.6    2.5  0.11  23.0
Cen X-3               170.320  -60.621 0.6  292.092   +0.340    9.2  0.13  69.3    1.0  0.12   8.4
H 1636-536            250.185  -53.755 1.6  332.894   -4.800    6.1  0.33  18.3    3.4  0.30  11.4
AX J1632.8-4746       248.102  -47.711 0.0  336.493   +0.234    5.4  0.00  14.3    0.0  0.00   0.0
4U 1323-62            201.650  -62.146 2.1  307.026   +0.446    1.4  0.11  12.6    0.6  0.10   5.5
Circinus Galaxy       213.291  -65.330 2.2  311.329   -3.799    1.4  0.11  12.5    0.6  0.10   6.1
SGR 1627-41           248.909  -47.647 2.7  336.907   -0.122    4.7  0.47  10.0    2.5  0.35   7.2
H 1417-624            215.289  -62.690 2.4  313.018   -1.588    1.2  0.10  11.4    0.5  0.10   4.9
GX 339-4              255.664  -48.829 2.4  338.891   -4.328    9.8  0.90  10.9    6.4  0.71   9.0
H 1538-522            235.725  -52.432 3.3  327.454   +2.080    1.2  0.15   7.9    0.0  0.00   0.0
PSR B1509-58          228.539  -59.115 2.9  320.357   -1.159    1.0  0.11   9.2    0.7  0.10   6.9
IGR J15094-6649       227.676  -66.826 5.0  316.032   -7.565    0.7  0.14   4.9    0.0  0.00   0.0
IGR J16167-4957       244.060  -49.909 0.0  333.060   +0.590    1.2  0.00   5.1    0.0  0.00   0.0
1E 1145.1-6141        176.803  -61.916 0.0  295.450   +0.019    0.6  0.00   4.7    0.0  0.00   0.0
4U 1626-67            247.868  -67.482 5.9  321.719  -13.048    1.3  0.32   4.1    0.0  0.00   0.0
MAXIJ1631-479 (NEW_1) 247.759  -47.817 0.6  336.258   +0.330   22.9  0.38  60.8    0.9  0.18   4.7
JEM-X Detected Sources 3-10 keV
Note: Sources labelled were detected in the 3-10 keV image > 5σ and are listed in the table below. Fluxes are extracted at the known catalogue position of the source (i.e. no fitting of the source position is done), with
j_ima_src_locator in 3-10 keV energy band.
    Source Name             RA             dec            A(cps)          sigma
====================   =============   =============   =============   =============
Cen X-3                1.7030515E+02  -6.0624531E+01   2.3986744E-02   3.5268143E+02
GX 301-2               1.8664713E+02  -6.2772503E+01   1.8636884E-02   3.0273120E+02
Cir X-1                2.3016237E+02  -5.7164032E+01   3.5951138E-03   8.9860527E+01
H 1417-624             2.1529340E+02  -6.2706097E+01   5.5527588E-04   1.9532112E+01
4U 1323-62             2.0164465E+02  -6.2126987E+01   4.5379414E-04   1.3419282E+01
1H 1045-597            1.6127800E+02  -5.9676659E+01   3.3305015E-04   7.9490037E+00
1E 1145.1-6141         1.7687233E+02  -6.1959011E+01   5.2052556E-04   7.7086697E+00