INTEGRAL Galactic Plane Scanning
Revolution 1611: Observation start 2015-11-18T01:28 = MJD 57344.062
Total Observation GTI = 44539 seconds
ISGRI
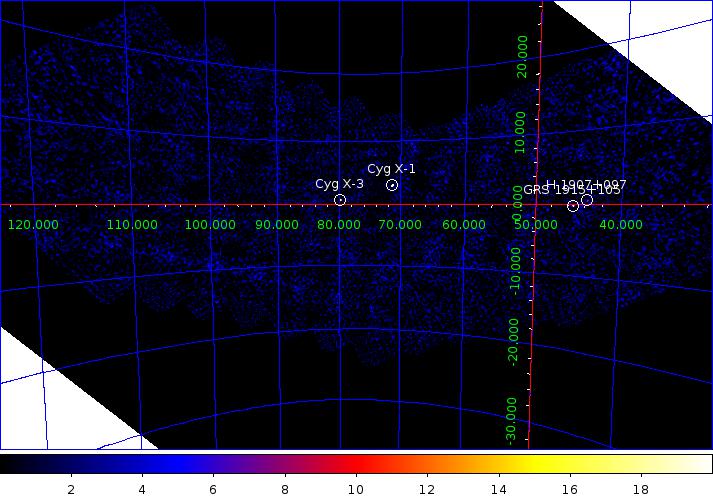

ISGRI significance mosaic images. Top: ISGRI 18-40 keV. Bottom: 40-100 keV
Sources detected > 10σ in each band are marked on the image. The table below lists the fitted position, and statistical positional uncertainty in arcmin returned by the mosaic step of
OSA9, of all the sources detected in the 18 - 40 keV range (band A: 1 Crab ~ 176 cps ) and 40 - 100 keV range (band B: 1 Crab ~ 88 cps ) where available.ISGRI Detected Sources 18-40 keV (A) and 40-100 keV (B)
Source Name             RA       dec   +/-    l        b     A(cps)  +/-   sig  B(cps)  +/-   sig
==================== ========  ======= === ======== ======== ====== ===== ===== ====== ===== =====
Cyg X-1               299.596  +35.199 0.4   71.335   +3.062   63.0  0.49 128.5   32.6  0.31 104.2
Cyg X-3               308.112  +40.948 0.6   79.840   +0.692   22.3  0.36  61.2    5.9  0.23  25.1
GRS 1915+105          288.812  +10.939 1.1   45.366   -0.235   10.4  0.38  27.2    0.0  0.00   0.0
H 1907+097            287.387   +9.812 2.5   43.718   +0.486    4.2  0.40  10.5    0.0  0.00   0.0
4U 1909+07            287.698   +7.580 3.9   41.880   -0.817    2.8  0.43   6.5    0.0  0.00   0.0
JEM-X
Fluxes are extracted at the known catalogue position of the source (i.e. no fitting of the source position is done), withj_ima_src_locator in 3-10 keV energy band.
    Source Name             RA             dec            A(cps)          sigma
====================   =============   =============   =============   =============
Cyg X-3                3.0810730E+02   4.0948093E+01   1.0638587E-02   4.6469776E+01
IGR J21247+5058        3.2119598E+02   5.0971348E+01   4.5894849E-04   5.9397426E+00
GRS 1915+105           2.8879907E+02   1.0946445E+01   9.1042027E-02   2.5733578E+02