INTEGRAL Galactic Plane Scanning
Revolution 1180: Observation start 2012-06-12T00:59 = MJD 56090.042
Total Observation GTI = 33157 seconds
ISGRI

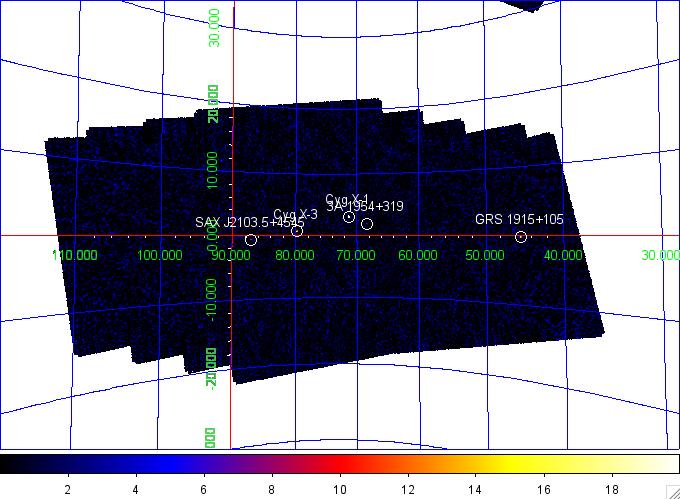
ISGRI significance mosaic images. Top: ISGRI 18-40 keV. Bottom: 40-100 keV
Sources detected > 10σ in each band are marked on the image. The table below lists the fitted position, and statistical positional uncertainty in arcmin returned by the mosaic step of
OSA9, of all the sources detected in the 18 - 40 keV range (band A: 1 Crab ~ 176 cps ) and 40 - 100 keV range (band B: 1 Crab ~ 88 cps ) where available.ISGRI Detected Sources 18-40 keV (A) and 40-100 keV (B)
Source Name             RA       dec   +/-    l        b     A(cps)  +/-   sig  B(cps)  +/-   sig
==================== ========  ======= === ======== ======== ====== ===== ===== ====== ===== =====
Cyg X-1               299.590  +35.200 0.3   71.333   +3.066   81.2  0.43 188.8   33.5  0.31 109.7
Cyg X-3               308.110  +40.958 0.5   79.847   +0.699   33.4  0.42  79.1    6.8  0.31  22.2
GRS 1915+105          288.802  +10.940 0.7   45.363   -0.225   39.2  0.81  48.6    0.0  0.00   0.0
3A 1954+319           298.925  +32.092 0.8   68.387   +1.926   14.6  0.36  40.4    0.0  0.00   0.0
SAX J2103.5+4545      315.892  +45.754 1.1   87.129   -0.680    9.6  0.34  28.1    0.0  0.00   0.0
Her X-1               254.466  +35.334 1.2   58.140  +37.515   53.6  2.25  23.8    0.0  0.00   0.0
IGR J19294+1816       292.489  +18.307 4.0   53.540   +0.108    2.8  0.43   6.3    0.0  0.00   0.0
JEM-X
JEM-X1 and JEM-X2 significance mosaic images in 3-10 keV energy band.
Note: Sources labelled were detected in the 3-10 keV image > 5σ and are listed in the table below. Fluxes are extracted at the known catalogue position of the source (i.e. no fitting of the source position is done), with
j_ima_src_locator in 3-10 keV energy band.
    Source Name             RA             dec            A(cps)          sigma
====================   =============   =============   =============   =============
Cyg X-1                2.9958740E+02   3.5200024E+01   1.5921649E+01   2.1047931E+02
3A 1954+319            2.9892896E+02   3.2093838E+01   1.7419624E+00   5.6399288E+01
SAX J2103.5+4545       3.1588962E+02   4.5758396E+01   7.2767615E-01   1.9115606E+01
Cyg X-1                2.9958704E+02   3.5200600E+01   1.5722451E+01   2.0981494E+02